问题1: PCA在sklearn中的哪个模块?
答:PCA在sklearn的decomposition模块中。通过from sklearn.decomposition import PCA可以导入PCA。sklearn.decomposition模块包括矩阵分解算法,包括PCA,NMF或ICA。 该模块的大多数算法可以被视为降维技术。官网介绍
问题2:在利用PCA算法中,用什么指标来判断一个特征对整体数据的影响大小?
答: PCA中有一个特殊的指标explained_variance_ratio_(解释方差比例), 表示所保留的n个成分各自的方差百分比,它们的和越大,表示保留原来数据的信息越多。它是一个矩阵,每一个值在0~1之间,代表着该特征值对样本值得影响大小。比如在下面例子中,我计算出前2个主成分,pca.explained_variance_ratio_=[0.14566817, 0.13735469] 。这说明第一个特征主成分方差值占总方差的14.56。 如果把所有特征的主成分都求出来,那么explained_variance_ratio_就是一个N个元素由大到小排列好的数组,越在前面的数据说明占据总方差的数据也越大,越说明越重要。
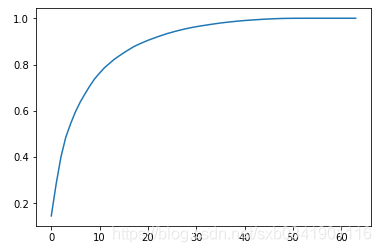
我们绘制出digits数据集的前N个主成分方差占比折线图:

就可以看出大概过了前30个主成分占总方差的0.9以上,后面的主成分对整体的数据影响较小。
问题3:在使用PCA的过程中,我如何来确定一个高危数据应该降到几维最合适?
答: Sklearn中PCA初始化时候设置参数n_components 来实现。在前面的学习中,我们把n_components定义为一个整数,是用来指定我们获取的前N个主成分。而在Sklearn中这个参数可以是float类型,如果是float,并且其他参数是默认的,那么这个字段表示你想保留原来数据信息的比率, 也就是上一个问题说到的explained_variance_ratio_。
用法如下:
pca = PCA(0.95)pca.fit(X_train)
通过这种用法表示利用PCA降维保持原来数据95%以上的信息。 然后利用pca.n_components_就可以看到具体降到几维了。在digits这个数据样本中pca.n_components_是为28. 也就是说只要求出前28个主成分就可以保留原来数据的95%信息。
问题4:如何对数据进行降维可视化?
我们一般只能可视化2维或者3维的数据,只要超过了我们就不能进行可视化。 所以利用PCA我们可以求出前2个主成分分析,然后把数据可视化出来,这边我们对数据有个大概的理解。数据可视化工具主要是利用matplotlib. 可以参考代码实例。
代码:
# -*- coding: utf-8 -*-from sklearn.decomposition import PCAfrom sklearn.datasets import load_digitsfrom sklearn.neighbors import KNeighborsClassifierfrom sklearn.model_selection import train_test_split from timeit import timeit X, y = load_digits(return_X_y=True)print('X shape:', X.shape) # 此处会看到X是64维的数据X_train, x_test, y_train, y_test = train_test_split(X, y) def exec_without_pca(): knn_clf = KNeighborsClassifier() knn_clf.fit(X_train, y_train) print (knn_clf.score(x_test, y_test)) def exec_with_pca(): knn_clf = KNeighborsClassifier() pca = PCA(n_components=0.95) pca.fit(X_train, y_train) X_train_dunction = pca.transform(X_train) X_test_dunction = pca.transform(x_test) knn_clf.fit(X_train_dunction, y_train) print (knn_clf.score(X_test_dunction, y_test)) if __name__ == '__main__': print ('Time of method[exec_with_pca] costs:', timeit('exec_without_pca()', setup='from __main__ import exec_without_pca', number=3)) print '----' * 10 print ('Time of method[exec_with_pca] costs:', timeit('exec_with_pca()', setup='from __main__ import exec_with_pca', number=3))
运行结果
(‘X shape:’, (1797L, 64L)) 0.9888888888888889 0.9888888888888889 0.9888888888888889 (‘Time of method[exec_with_pca] costs:’, 0.2033715630098584) ---------------------------------------- 0.9888888888888889 0.9888888888888889 0.9888888888888889 (‘Time of method[exec_with_pca] costs:’, 0.10723048678987901)
可以得出:
1、PCA降维后的数据大概能节省一半
2、 PCA降维后的数据进行准确度并没有丢失。
对数据降维的代码:
def draw_graph(): # 绘制主成分增加对原数据的保留信息影响 # pca = PCA(n_components=X_train.shape[1]) # pca.fit(X_train) # plt.plot([i for i in range(X_train.shape[1])], # [np.sum(pca.explained_variance_ratio_[:i + 1]) for i in range(X_train.shape[1])]) # plt.show() # 把64维降维2维,进行数据可视化 pca = PCA(n_components=2) pca.fit(X) X_reduction = pca.transform(X) for i in range(10): plt.scatter(X_reduction[y==i,0], X_reduction[y==i,1], alpha=0.8, label='%s' % i) plt.legend() plt.show()
降维数据可视化结果:
